School Accountability: Profiles of Performance
The
Every Student Succeeds Act (ESSA) calls on states to provide clear, annual feedback on how schools are serving students—and recognizes that learning is more than one score or outcome. In Illinois, each school’s
Profile of Performance brings together core academic indicators—proficiency, growth, and graduation rate, reflecting what students know and can do, how much they grow over time, and their preparation for life after high school—along with select, practical indicators that provide schools with actionable insight to improve culture, engagement, and outcomes.
calls on states to provide clear, annual feedback on how schools are serving students—and recognizes that learning is more than one score or outcome. In Illinois, each school’s
Profile of Performance brings together core academic indicators—proficiency, growth, and graduation rate, reflecting what students know and can do, how much they grow over time, and their preparation for life after high school—along with select, practical indicators that provide schools with actionable insight to improve culture, engagement, and outcomes.
These profiles are a starting point for ongoing improvement in every school, no matter where it begins. By providing a more complete picture of performance, the system helps schools, districts, and communities ask better questions, focus on what matters most for students, and take meaningful steps to support success for all learners.
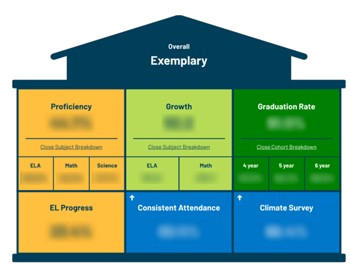
Profile of Performance
Core Indicators
Proficiency, Growth, Graduation Rate
Core Indicators recognize school strengths on critical student outcomes.
Elevating Indicators
EL Progress, Consistent Attendance, Climate Survey
Strong performance on elevating indicators can raise a school's designation, never lower it.
